Fernanda Delestre
|
0
|
July 19, 2024



Time Travel Debugging (TTD) is a technique that records a program’s entire execution so analysts can explore it afterward, forward and backward, without rerunning the code. Once captured, the execution trace becomes a persistent dataset that can be revisited at any time. Analysts can navigate back and forth through the recorded timeline, pinpointing specific moments to investigate vulnerabilities, bugs, or unexpected behavior.
A trace preserves every aspect of a program’s runtime, including memory states, register and variable changes, and function calls. With that complete view of execution, you can find the root cause of an issue and understand its broader implications, whether it sits in a user-level process or deep in the kernel. You record the bug once, and you never have to reproduce it again.
Time travel debugging happens in two steps. First, a recorder runs the target and captures what happens during execution. Then, a replay or analysis tool lets you move through that recording as if it were a video of the program: play it, pause it, rewind it, or jump straight to a given instruction.
Recorders capture execution in one of two ways. Some log only the sources of non-determinism, such as system call results, signals, and thread scheduling, and then re-execute the program faithfully during replay. Others log the effect of every instruction, so the full history of each register and memory address is stored in the trace itself. The second approach produces larger traces, but it lets you ask questions that a simple rewind can’t answer, such as “which instruction last wrote this byte?” or “where did this value come from?”
The scope of the recording matters as much as the method. Most tools record a single user-mode process. Full-system tools record a whole virtual machine (the kernel, the drivers, and every process) in one trace, so you can follow a call from an application into a driver and back on a single timeline.
As software systems grow increasingly complex, traditional debugging methods often struggle with intricate, hard-to-reproduce bugs. That gap is what drove the development of time travel debugging. Each method has its own strengths, so it’s worth choosing the right one for the task at hand. For a deeper comparison, read Time Travel Debugging vs. Traditional Debuggers.
Traditional debugging involves setting breakpoints and stepping through code line by line. Developers examine variable values and control flow at each breakpoint to identify and fix bugs. It also requires reproducing the bug manually, often over many attempts, to recreate the exact conditions under which it occurs. If you step past the interesting moment, you have to start again. This is time-consuming, especially for intermittent issues.
Best For: simpler bugs and scenarios where the issue can be easily reproduced and the program state is straightforward to inspect.
Time Travel Debugging enables precise navigation through a program’s execution history, allowing you to inspect its state at any point in time. It provides a detailed view of the sequence of events leading up to a bug or unexpected behavior.
It records the entire execution history, capturing critical data such as memory states, variable values, and system interactions. This persistent dataset can be replayed as many times as needed, and every replay is identical, so the analysis never depends on the bug showing up again.
Best For: complex, hard-to-reproduce bugs and scenarios where understanding the full execution history is crucial. It is particularly useful for modern applications with multi-threading, asynchronous operations, and intricate workflows, and for security work, where the code under analysis may be actively trying to hide what it does.
Reverse Debugging: The term is often used as a synonym for time travel debugging. In its narrower sense, it means a debugger that can step backward from the current position, like GDB’s built-in reverse-step. That is useful, but it usually covers a short window of recent history and runs only during the live session, without the persistent, shareable trace and the data queries that full time travel debugging offers.
Live Debugging: In live debugging, developers interact with the running application to inspect and modify its state in real time. This method is highly interactive, but it can disrupt the user experience, and it requires effort to reproduce the issue repeatedly. In malware analysis, an attached debugger is also easy for the sample to detect.
Post-Mortem Debugging: This involves analyzing crash dumps or core dumps generated when a program crashes. It provides a snapshot of the program’s state at the moment of failure, but it can’t trace back through the execution history to show how that state came about.
Root cause analysis of crashes. Start at the crash and walk backward to the write that corrupted the data. This is especially effective on crashes found by a fuzzer, where the input is known but the path to the failure isn’t. See Time Travel Debugging for Fuzzing Crash Analysis.
Intermittent bugs and race conditions. A bug that appears once in a thousand runs only needs to be recorded once. After that, the faulty interleaving is frozen in the trace and can be studied at leisure.
Vulnerability research and exploit analysis. Researchers follow attacker-controlled input through a program to see exactly where it takes control. For an example, see how an AI agent rebuilt a VLC exploit in a 4.78-billion-instruction trace.
Malware analysis. Record a sample once and analyze its behavior offline, including the parts that only run in memory. Read How to Reverse Engineer Malware with Time Travel Debugging.
Kernel, driver, mobile, and firmware analysis. With a full-system recorder, the same technique works on Windows drivers, Android apps, and embedded firmware running in QEMU.
Time travel debugging has been around since at least 2003, when the Omniscient Debugger brought it to Java. Today, the main tools differ mostly by what they record.
Process-level tools record one program at a time. Microsoft’s WinDbg TTD records a single user-mode process on Windows. On Linux, rr records and replays user-space processes and exposes them through GDB, and Undo’s UDB offers commercial recording for Linux applications. These tools are a great fit for application developers, but they stop at the process boundary, so kernel code, drivers, and the interactions between processes stay out of view. We cover this in WinDbg TTD Limitations, and Full-System Time Travel Debugging.
Full-system tools record an entire emulated machine. Because nothing is attached to the target, the program can’t see a debugger, and one trace covers every layer from the kernel up to each application. eShard’s Epoch (formerly Reven) works this way.
Time travel debugging comes with trade-offs. Recording is slower than running the program normally, and traces of long executions can reach billions of instructions and take significant disk space. Good tools compensate with fast indexing and search, but it still pays to record only the scenario you need.
A recording also can’t be edited. If you want to see what happens with a different input or a patched variable, you record a new trace. Finally, emulation-based recorders can be detected by software that checks for virtual machines. Most of those checks can be neutralized while recording, but a few that target the emulator itself are harder to beat.
Traces have become one of the most useful sources of evidence for AI agents. An agent reading disassembly has to guess what the code does at runtime. An agent querying a trace can check its guesses against what actually happened, at the exact instruction, and do it across billions of instructions far faster than a person scrolling through them. When an agent loses its context, it can simply query the trace again.
This is the idea behind Epoch: time travel debugging built for the agentic era. In one case study, an AI agent found a key split between user and kernel code in six minutes. Every finding still points to a precise moment in the trace, so the analyst can verify it.
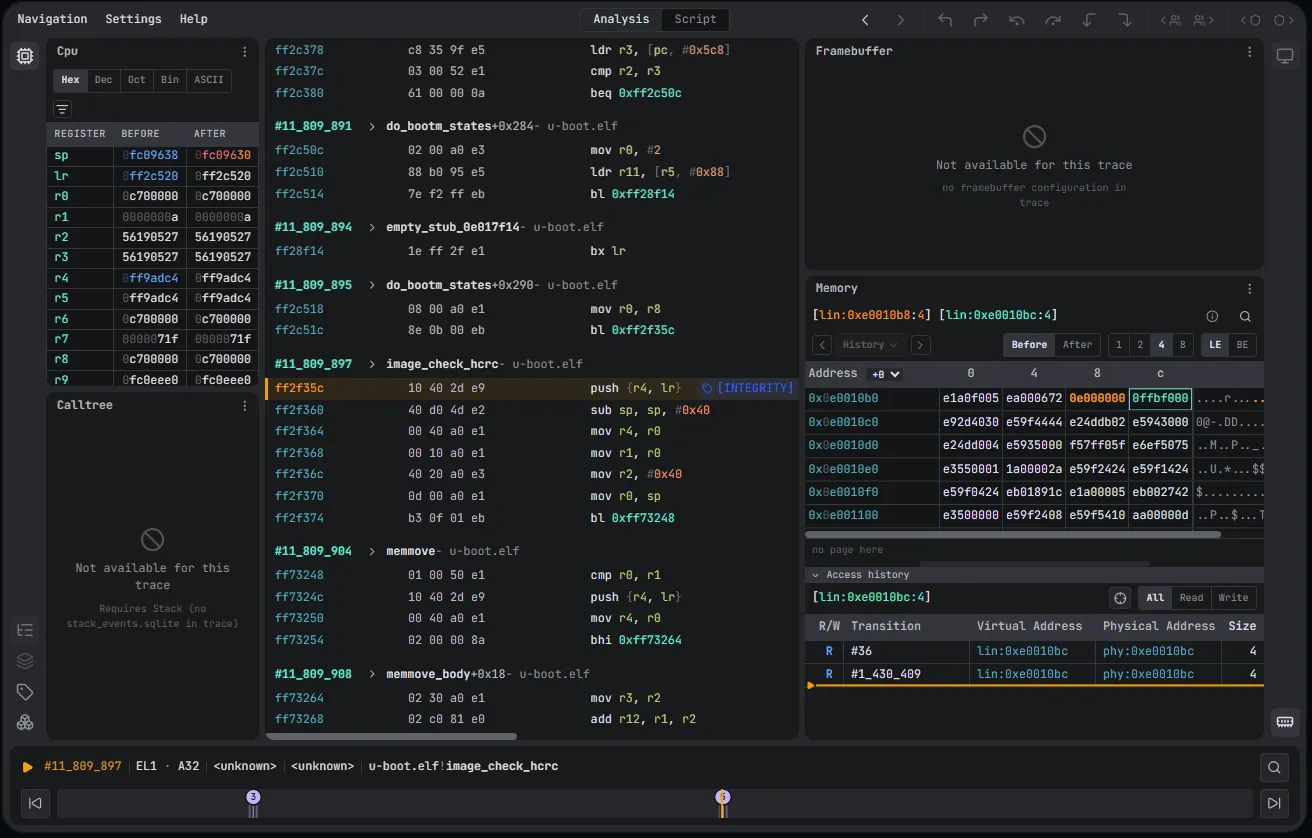
eShard’s time travel debugging tool is now Epoch (formerly Reven). It records the whole system, kernel, drivers, and every process, in one trace, on Intel and Arm, for Windows, Linux, Android, and IoT targets. Working with Epoch follows three steps.
Emulate. Get the target running in a recordable environment. On Windows, Lite VM Studio builds a recording-ready VM in about half an hour, or you can import your own. For embedded devices, the firmware is rehosted in emulation (see firmware analysis).
Record. Epoch Studio captures the full system in a single pass. Every instruction, memory change, and register state lands in a persistent trace file.
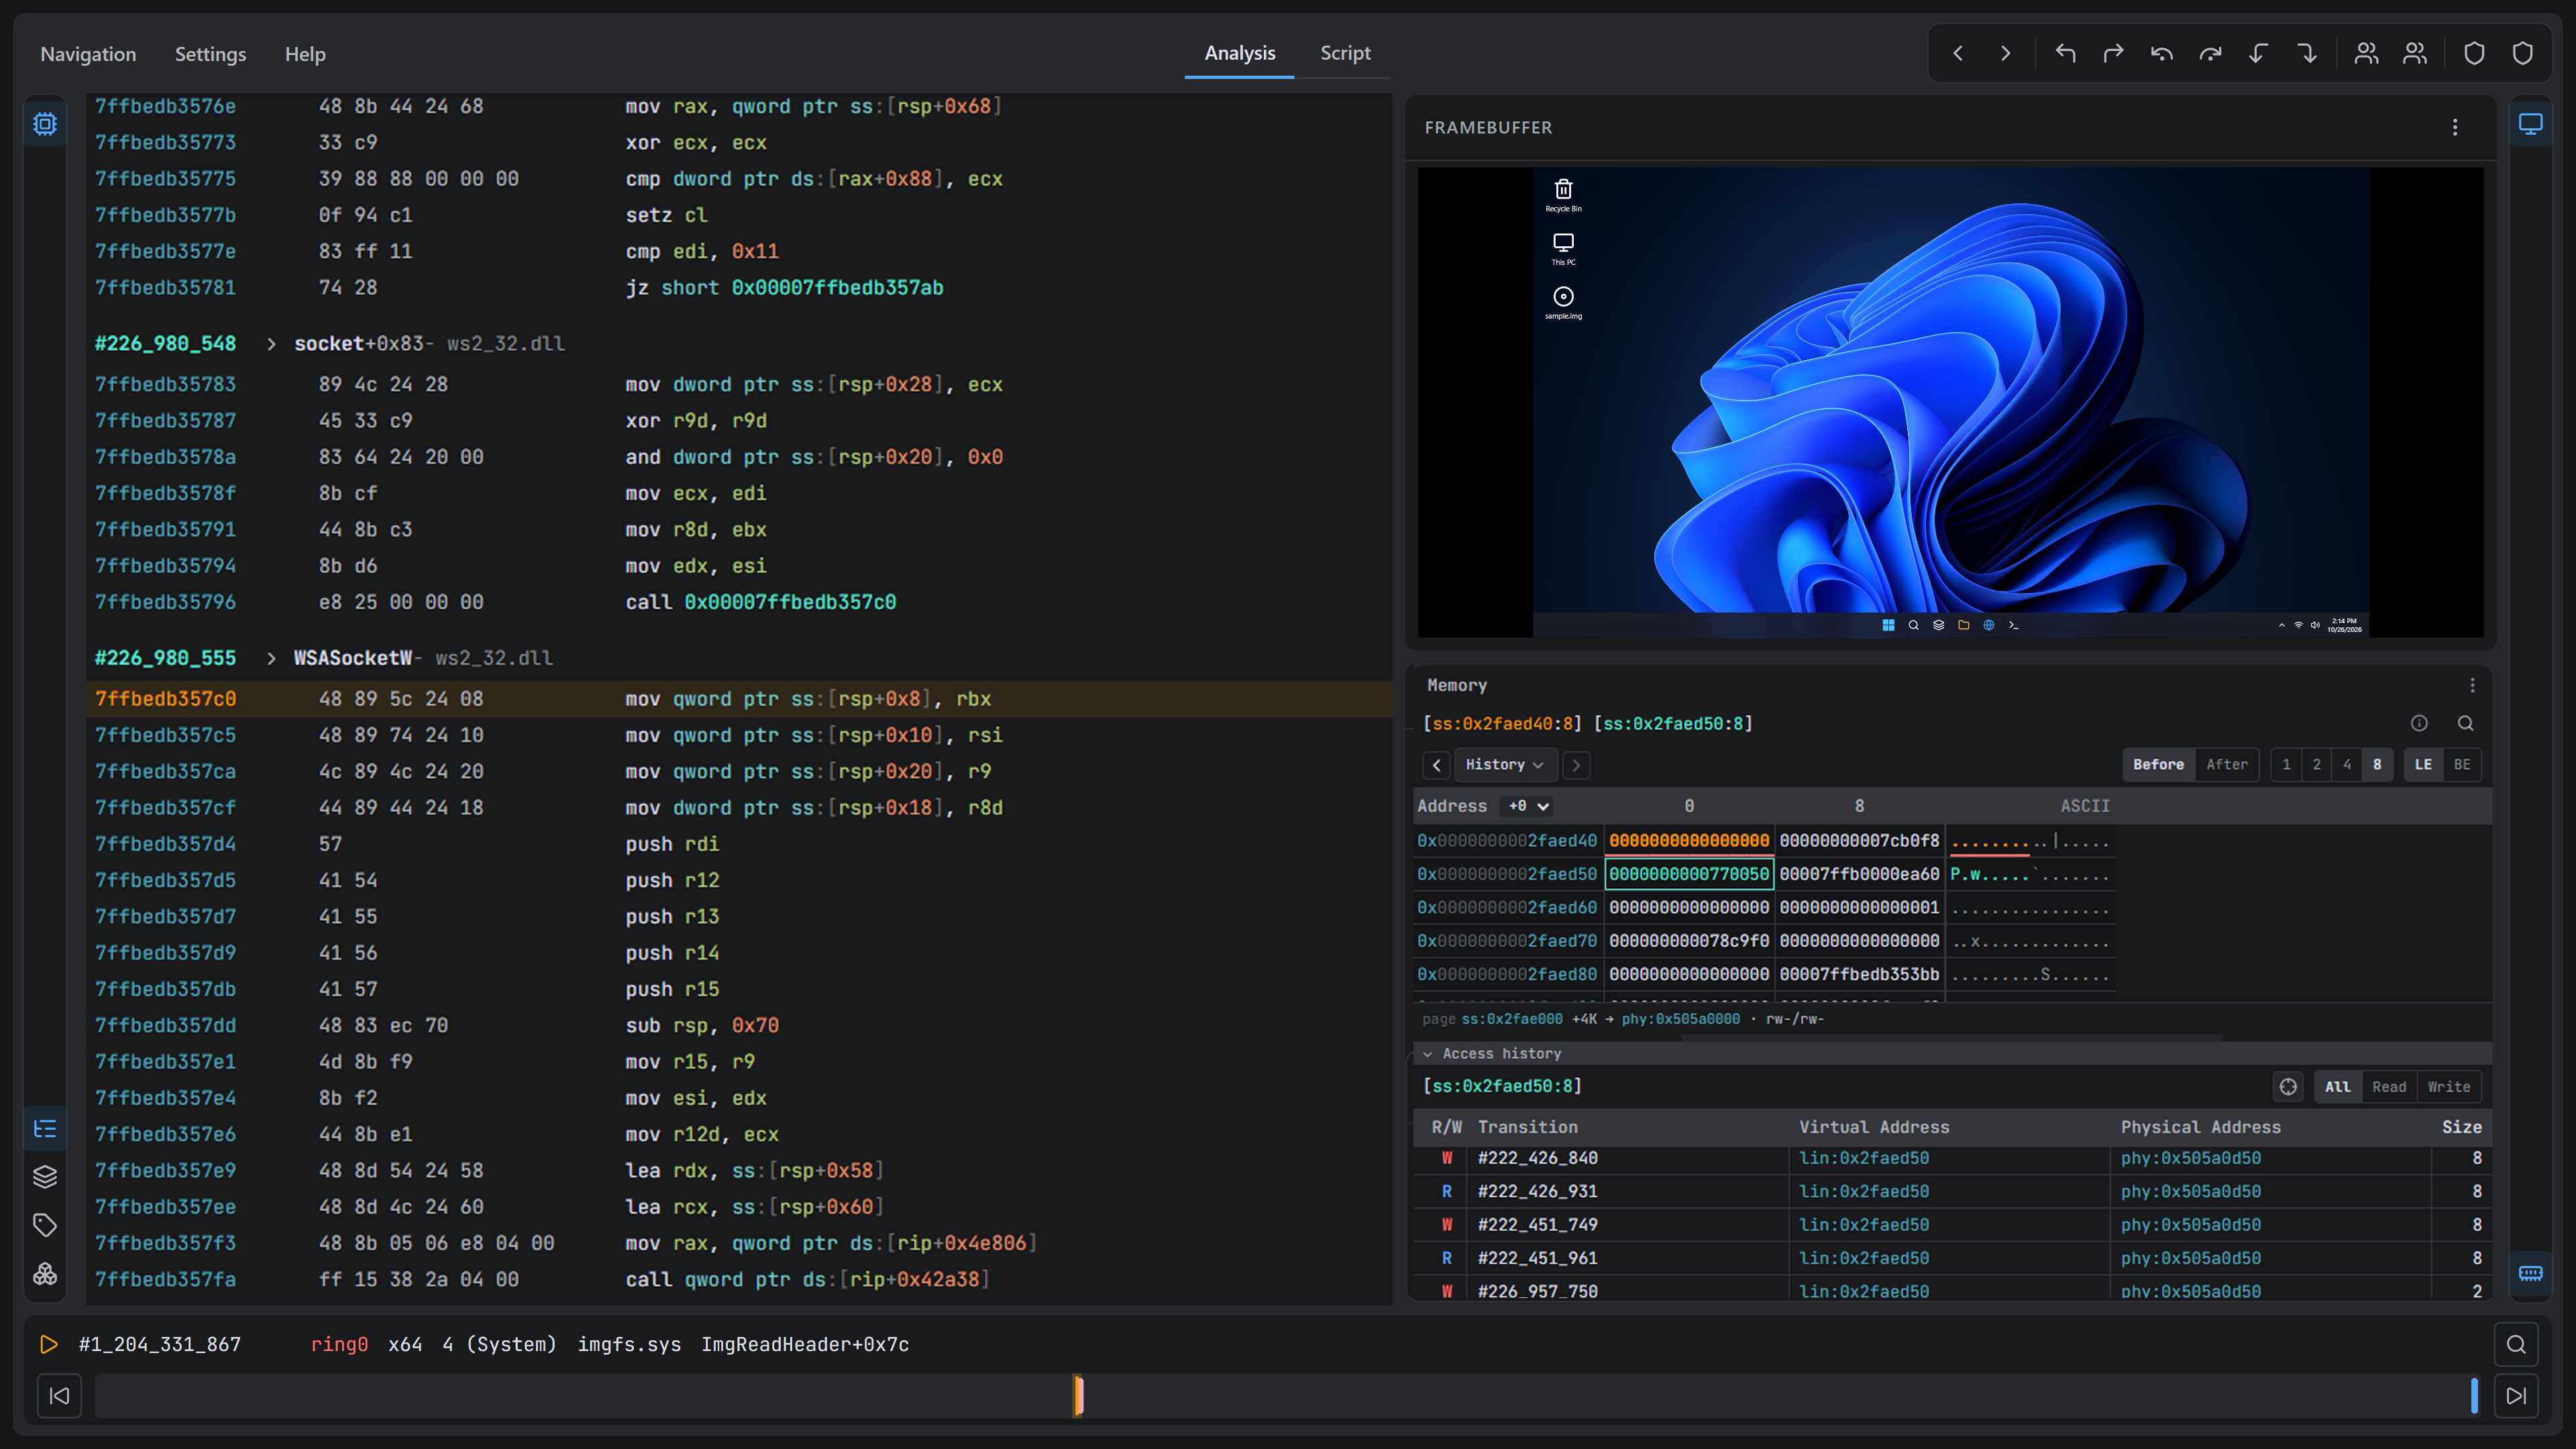
Analyze. Epoch Analysis lets you step forward and backward, jump to any instruction, follow memory read and write history, resolve symbols, search strings, and apply taint analysis to see where data comes from and where it goes. Epoch AI connects the AI assistant you already use to the trace through a dedicated MCP server, so it can answer questions and tag what it finds for you to check. Epoch is on-premises by design. For Windows specifically, see time travel debugging for Windows.
When an investigation involves a team, esReverse adds a collaborative layer on top. If you encounter an issue you can’t resolve yourself, you can share the trace with a coworker. They see exactly what you’re seeing, which is far easier than collaborating over a live debugging session. Recorded instructions remain consistent, whereas address locations and code execution can vary from one machine to the next. You can also share a specific point in time to help your coworker know where to start.
Our team will show you how Epoch fits the way you work.
Want to explore first? Test the Epoch engine at ttd.eshard.com. Free, no sign-up, no credit card.
Mostly, yes. Both let you move backward through execution. “Time travel debugging” usually implies a complete recording that can be replayed, queried, and shared, while “reverse debugging” sometimes refers only to stepping back within a live session.
It depends on the tool. WinDbg TTD, rr, and UDB record user-mode processes. Full-system tools such as Epoch record the kernel, drivers, and all processes together.
Yes, recording adds overhead, and the amount varies widely between tools and workloads. Once the trace exists, the analysis itself doesn’t depend on the program’s speed, and you never need to run it again.
Yes. WinDbg TTD and rr are free for process-level recording. To try full-system time travel debugging, you can explore real Epoch traces in your browser at ttd.eshard.com, with no install, no credit card, and no ID.

