Pierre Mondon
|
0
|
November 25, 2024


This article follows our blogpost on our journey for instrumenting Tenda AC15 firmware for time travel analysis. If you have not read the last article, we encourage you to do so as it sets the tone for the following post. We have instrumented the firmware of a Tenda router (AC15) so that we can perform Time Travel analysis on an execution. In this blogpost, we will analyse the ‘CVE-2024-2815’ using Time Travel Analysis.
In the following, we will start by summarising the reported vulnerability and technical details. Second, we will analyse the reproduced vulnerability with the time travel engine of esReverse. Third, we will discuss the differences between the reported vulnerability and the analysis we performed. No spoils here, but there are some exciting twists waiting at the end!
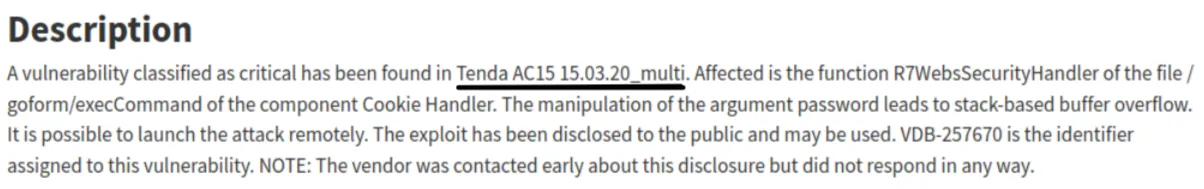
The reported CVE (on vulnDB) mentions the firmware ‘Tenda AC15 15.03.20_multi’. However, the associated PoC on Github mentions ‘AC15 V15.03.05.18’.
The firmware ‘AC15 V15.03.05.18’ is publicly available here.
This vulnerability is reported as a stack based buffer overflow. The affected function of the web interface is ‘R7WebsSecurityHandler’. The CVE mentions that the vulnerability is in the file ‘/goform/execCommand’ of the component ‘Cookie Handler’. There is an unsafe copy on the argument ‘password’ leading to the buffer overflow. On ‘vulnDB’, there is a link to the ‘GitHub’ proof of concept.
import requests


ip = "ROUTER_IP_ADD:WEB_INTERFACE_PORT"
url = "http://%s/goform/execCommand"%ip
cookie = {"Cookie":"password=" + "A"*1000}
ret = requests.get(url=url,cookies=cookie)
print(ret.text)

Vulnerability detail according to the PoC
According to the PoC, the insecure copy comes from a call to ‘strcpy’ from the user controlled input ‘password’ in ‘R7WebsSecurityHandler’.
Alongside that description comes a few screenshots of the decompiled view of IDA

In that picture, there is indeed the ‘password’ word and there is a ‘strcpy’ from the variable ‘src’ (that is probably allocated and set inside of ‘sub_2BABC’) into the variable ‘v35’. The size of ‘v35’ is indeed ‘128’ bytes. That is, if ‘sub_2BABC’ initialises ‘src’ with a buffer larger than 128 bytes we would have a buffer overflow.
Now that we understand the reported vulnerability, we want to verify this information.
We have a working emulation with ‘Qiling’ that also allows us to perform Time Travel analysis (great right?!) But first, a quick introduction to time travel analysis is necessary, if you are already familiar with this you can go directly to the analysis.
In order to be able to talk about the vulnerability let’s do a quick introduction on time travel analysis. Here is an example of a very realistic scenario extracted from a very real firmware, just trust me:
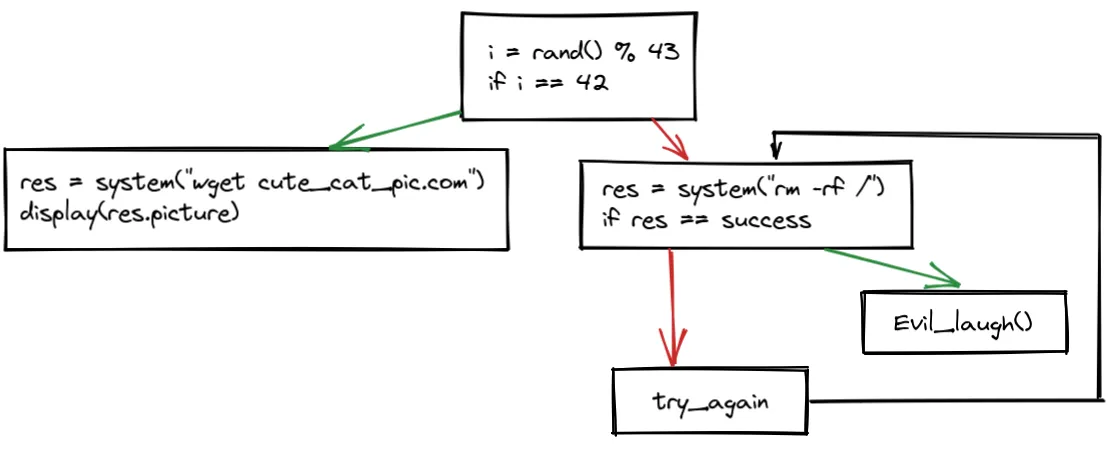
To analyse that code, you have to imagine what would happen at each step of that code. You need to imagine what happens if ‘i’ equals ‘42’. However, You may be inside a backdoored system where the function ‘rand()’ always returns ‘42’. In that paradigm, you are imagining the time going through your code and you are imagining what is happening at each step.
Now let us look at the same code in the context of that backdoored system inside of a time travel tool:
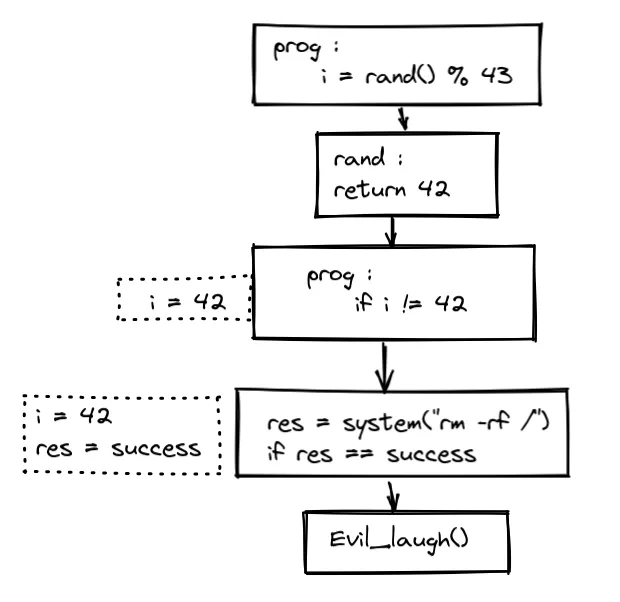
In our case a ‘step’ is a line of code. In a way less realistic let’s face it binary, each assembly instruction would be a ‘step’. The tool shows you the state of the memory at each ‘step’ of the execution. You can track the execution inside the libraries as well.
Here, the value of ‘i’ is ‘42’, so no need to bother about the other parts of the code that are not executed anyway.
Because you have access to the entire memory at each step of the execution, you can go back and forth on your analysis without having to stop the emulation at the right time.
To summarise, this changes the paradox with which you see your code. With time travel analysis, you can see your code going through time alongside the memory.
Now we understand a bit what is time travel let’s show and dissect our GUI:

We have different views inside of that GUI:
We won’t detail each view, but let’s focus on those we will use for our analysis:

This view allows you to disassemble a certain step of the trace. the number ‘8 037 612’ corresponds to the step id, that is, this is the ‘n’-th executed instruction. You can navigate the entire disassembly of the trace by scrolling in this view. By clicking on an instruction you ‘‘select’’ a step, and all the other views will synchronize on that ‘step’.

This view shows the content of each register at the selected step. You have the information for two ‘context’:
You have of course some nice features to filter and modify the display but let’s keep it simple for this blogpost.

This can be seen as a hexdump of a memory region. You can view the content of any memory address at any step of the time travel trace. You can view it in the context before or after a step, this is useful to monitor the effect of an instruction on a memory zone for example.

Although technically part of the memory view, we decided to talk about it separately. This functionality allows you to select an address or a range of addresses in the memory view, and it will give you each step in the trace that either read or wrote the selected address/es. You can imagine how powerful that is, and if you can’t, you will understand soon.

This view allows you to search inside of the trace during a specific time range or in the entire trace. You can search for:
This is useful as we will see if we are interested to know if a certain function is called, or even if an instruction is ever called.
That’s when our last blogpost stopped, so if you haven’t read it and you are curious about how we adapted Qiling to perform Time Travel Analysis, go have a look here 😉
Now we understand time travel and its dedicated GUI. We also have a time travel trace of the vulnerability. Let’s have a look shall we?
First, we go at the last step of the trace, this is, the moment the web interface crashed due to the vulnerability. Once at that step, we can see in the disassembly view the last executed instruction:

We pop some values from the stack into registers, but most importantly, into ‘PC’. Let’s have a look at the register values. We use the filter ‘Only modified’ in the register view for clarity.
And indeed, our ‘PC’ value is ‘0x41414140’ (‘0x41’ in ascii is ‘A’). Our vulnerability is a buffer overflow where we send a large buffer with ‘‘AAAAAAAAAAAAAAAAAAAAAAAAAAAAAAA…AAAA’’. So our crash makes sense, we set the ‘PC’ at ‘0x41414140’ which isn’t a valid address with executable code.
Let’s have a look at the content of the stack and where does that data come from. In our GUI, we go up to the start of the buffer containing and we have a look at the ‘history of access’. Then we click on the last access to this address. Because all our views are synchronised, in the disassembly, we see the instruction responsible for the last write.


We are inside of the ‘libc’ in ‘vfscanf’. As we are interested in the original buffer, let’s go back in time to see the original caller responsible for that write. In our navigation toolbar we hit ‘step out backwards’ until we reach a ‘user function’, in our case, when we are back in the ‘R7WebsSecurityHandler’ function.
vfscanf -> vsscanf -> sscanf -> R7WebsSecurityHandler
‘sscanf’ first argument is the ‘char *’ from which the input that is read. The second argument is the format, then the arguments into which the formatted output will be stored.
Let’s see these arguments (‘r0’ ‘r1’ ‘r2’).
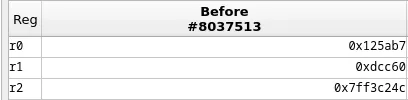


‘r2 = 0x7ff3c24c’
So, we are copying the value of the password field using a certain format into our stack. It turns out that ‘r2’ points at the start of our buffer causing the crash.
SO, we found the root cause of that crash. A ‘sscanf’ from the value of the ‘password’ parameter from the ‘Cookie’.
Let’s talk about the differences between the two ‘‘analysis’’.
In the reported vulnerability, they mention a ‘strcpy’, we found that inside of our ghidra view. This corresponds to the address ‘0x2fef4’ in the web interface binary. We can verify if this is called with our ‘search’ feature from time travel.
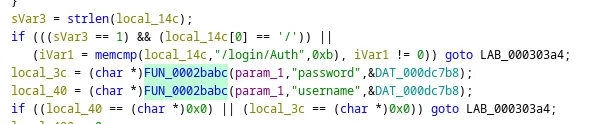
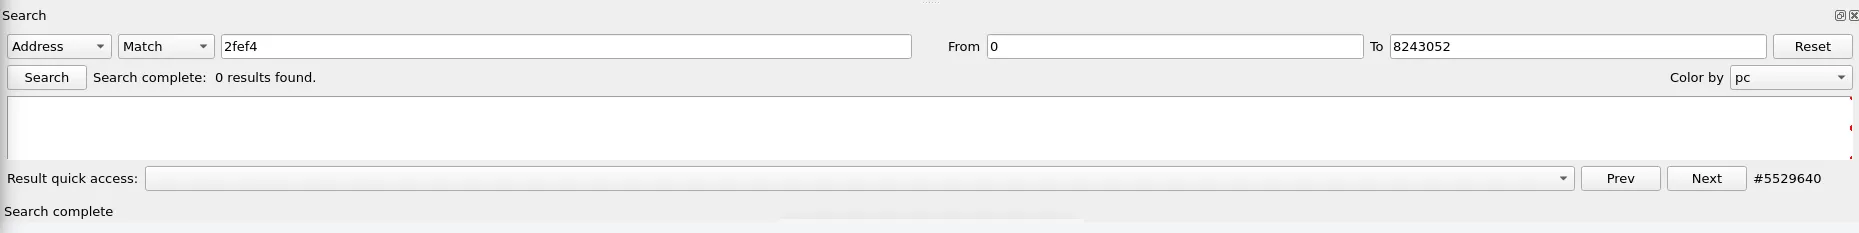
That address is never executed during the entire execution of the web interface when the crash occurs. Let’s do the same search feature with our ‘sscanf’ call in ghidra. This call is at ‘0x2f74c’


This time, we have a hit! This is executed once and conveniently at the exact place where we traced back our unsafe buffer.
Well, long story short, this isn’t necessary to trigger the bug. Actually, as long as you are in ‘/goform/’ and you are not in a predefined route handling the password cookie differently you will trigger the bug. For example, we modified the PoC to hit ‘/goform/lefoot’ and we managed to trigger the crash. As a matter of fact, the string_‘execCommand’_ is nowhere to be found in the web interface binary.

The reported vulnerability contains inexact details:
Through our analysis, we showed that the bug is due to an unsafe copy of the buffer with ‘sscanf’. The report was correct stating that the vulnerability is in the function ‘R7WebsSecurityHandler’. We have not been able to reproduce the bug on the firmware version ‘AC15 15.03.20_multi’ as we could not get a copy of it. Indeed, the link in the Github pointing to this version is broken:
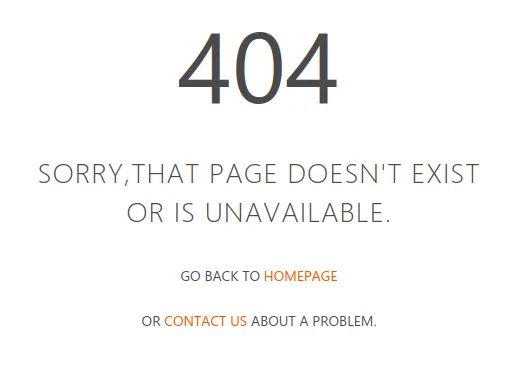
However, we know this bug is present on the firmware version ‘AC15 V15.03.05.18’ thanks to our Qiling emulation.
In our quest, we found that this bug was kind of a duplicate of the ‘cve-2018-5767’:

This bug was known in previous versions of the firmware. Tenda did not fix the bug, nor will they fix it as the product is discontinued.
We believe the reported CVE in 2024 was part of a fuzzing campaign as the same person reported several bugs on the same firmware with the same PoC each time. This may explain why their analysis wasn’t done in too much detail as knowing the exact cause of the bug doesn’t have any impact on the severity.

Stay tunned for the next step 😉


