


ALL-IN-ONE PLATFORM
esDynamic
Manage your attack workflows in a powerful and collaborative platform.
Expertise Modules
Executable catalog of attacks and techniques.
Infrastructure
Integrate your lab equipment and remotely manage your bench.
Lab equipments
Upgrade your lab with the latest hardware technologies.


PHYSICAL ATTACKS
Side Channel Attacks
Evaluate cryptography algorithms from data acquitition to result visualisation.
Fault Injection Attacks
Laser, Electromagnetic or Glitch to exploit a physical disruption.
Photoemission Analysis
Detect photon emissions from your IC to observe its behavior during operation.


EXPERTISE SERVICES
Evaluation Lab
Our team is ready to provide expert analysis of your hardware.
Starter Kits
Build know-how via built-in use cases developed on modern chips.
Cybersecurity Training
Grow expertise with hands-on training modules guided by a coach.


ALL-IN-ONE PLATFORM
esReverse
Static, dynamic and stress testing in a powerful and collaborative platform.
Extension: Intel x86, x64
Dynamic analyses for x86/x64 binaries with dedicated emulation frameworks.
Extension: ARM 32, 64
Dynamic analyses for ARM binaries with dedicated emulation frameworks.
DIFFERENT USAGES
Penetration Testing
Identify and exploit system vulnerabilities in a single platform.
Vulnerability Research
Uncover and address security gaps faster and more efficiently.
Code Audit & Verification
Effectively detect and neutralise harmful software.
Digital Forensics
Collaboratively analyse data to ensure thorough investigation.


EXPERTISE SERVICES
Software Assessment
Our team is ready to provide expert analysis of your binary code.
Cybersecurity training
Grow expertise with hands-on training modules guided by a coach.

INDUSTRIES
Semiconductor
Automotive
Security Lab
Gov. Agencies
Academics
Defense
Healthcare
Energy

ABOUT US
Why eShard?
Our team
Careers


FOLLOW US
Linkedin
Twitter
Youtube
Gitlab
Github


"Hack Trick" write-up: DG'hAck 2022


This challenge was a fun dive into a malware-like sample & kernel structures. Here is how we solved it:
Challenge presentation
The challenge's presentation is the following:
One of our employees recently tried to install a pirated game and as a result compromised his/her system.
The antivirus had been previously deactivated, and the executable turned out to be a malware.
We retrieved the executable file and now need your expertise in order to understand what the malware does.
Original in French:
Une de nos employées a récemment compromis son système en essayant d'installer un jeu cracké.
Son anti-virus avait été désactivé et l'exécutable s'est révélé être un malware.
Nous avons récupéré l'exécutable et avons désormais besoin de votre expertise pour comprendre ce que ce malware fait.
When starting the binary in a virtualized environment, we are greeted with the following error message:
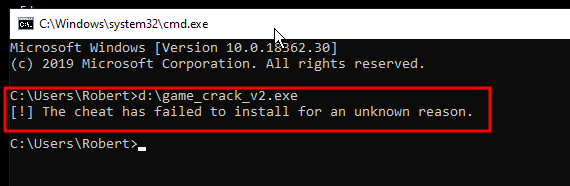
Has the malware already deployed? Or is it really an error message? Let's try to solve this challenge using a dynamic-first approach with REVEN & timeless analysis.
VM uptime
A quick record shows the following call tree, prior to the end of the program:
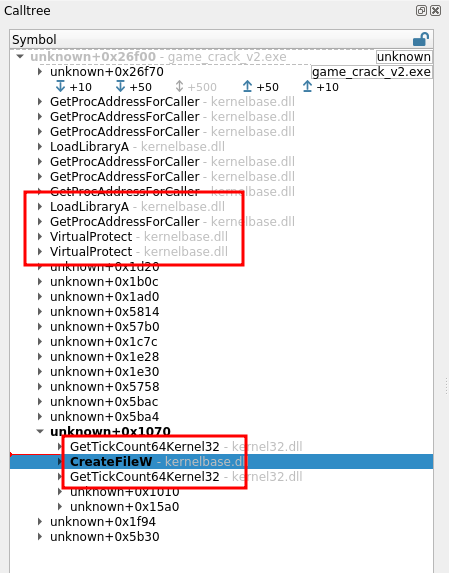
We can recognize two things from there:
First, the executable is (as expected) packed & obfuscated. This is made obvious by the various calls to VirtualProtect, LoadLibraryA. Also, if we take a look at the memory history of the code in location +0x1070, we see it has been extracted by the program.
We can ignore all that and jump straight to the 3 calls at the bottom that catch our attention:
GetTickCountCreateFileWGetTickCount
At first glance, we could assume the two calls of GetTickCount are used to measure the time spent in the CreateFile call.
However, when looking at the condition of the 2nd call to GetTickCount, it is obvious that its return value is used as is:
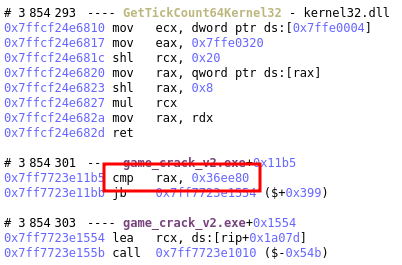
The program is simply checking whether the system's uptime is superior to 1 hour and if not, starts loading our error message at +0x1554. But then what about the first call to GetTickCount? Tainting that one's return value shows is copied over to r14 but apparently never used, making this call a possible red herring.
Defeating this first anti-analysis measure is simple:
- Either wait for the uptime to be high enough,
- Or force the system uptime.
We choose the 2nd path as the quickest. In the above image we see the address to the tick counter memory location at 0x7ffe0320. This value is updated by regular interrupts. Since the recording environment is a VM running in emulation, we can use GDB to connect to QEMU's gdbserver and edit the value ourselves:
(gdb) p/x (unsigned long)*(0x7ffe0320)
$3 = 0xc725
(gdb) set {unsigned long}(0x7ffe0320)=0x36ee90
(gdb) p/x (unsigned long)*(0x7ffe0320)
$4 = 0x36ee90
(gdb) c
Fun fact: after updating the value to force the uptime from a few minutes to an hour, the screen saver kicks in immediately and turns the screen black.
The file access
With this first obstacle bypassed, we are greeted with a different error message:
> game_crack_vs.exe
[!] Failed with error: 2
We record a 2nd trace to see what is going on. This time we find that the failing check is against the return value to CreateFile, so let's take a closer look to this call:
CreateFileW called at #3844876 call qword ptr ds:[rip+0x11e8c]
  lpFileName = \\.\Htsysm72FB
  dwDesiredAccess = 0xc0000000
  [...]
-> 0xffffffff
The program is trying to open a file named \\.\Htsysm72FB with R/W permissions. Of course, this file does not exist on the system, so the call fails & the program stops.
As a first approach, let's try to change the file name being open. Again, we'll use QEMU's GDB server to patch the memory.
(gdb) b *0x7ffcef994270
Breakpoint 4 at 0x7ffcef994270
(gdb) c
Continuing.

Breakpoint 4, 0x00007ffcef994270 in ?? ()
(gdb) set {char}$rcx = 'C'
(gdb) set {char}($rcx+2) = ':'
(gdb) set {char}($rcx+4) = '\\'
[...]
(gdb) set {char}($rcx+20) = '\0'
(gdb) c
Continuing.
Note: we place the breakpoint on CreateFileW at 0x7ffcef994270 in the system library because this address does not change between traces as we do not restart the VM between records, but restore a same live snapshot.
Note: if you know a simpler way to write wide char strings to memory, I'll gladly take it.
We get a different error message this time and the call tree gives us an interesting clue:
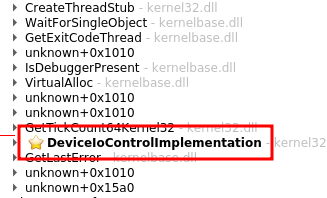
The program is trying to call DeviceIoControl against our file: this means it's not expecting a regular file, but a driver. In retrospect I guess the filename made this obvious already.
DeviceIoControl called at #23226158 call qword ptr ds:[rip+0x11d3c]
  hDevice = 0x1ac
  dwIoControlCode = 0xaa013044
  lpInBuffer = 0xfc268ffae0
  nInBufferSize = 0x8
  lpOutBuffer = 0xfc268ffad8
  nOutBufferSize = 0x4
-> 0x0
The IOCTL number is 0xaa013044. A quick Internet search shows our program is trying to communicate with a driver named Capcom.sys. This driver normally gets installed along with a game, and is very trivially used to execute code in the kernel, which the crackme is trying to do here.
Installing the driver
Hence, our next step is to install the driver in our VM:
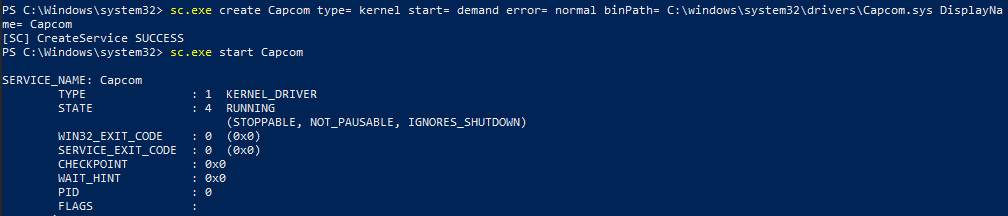
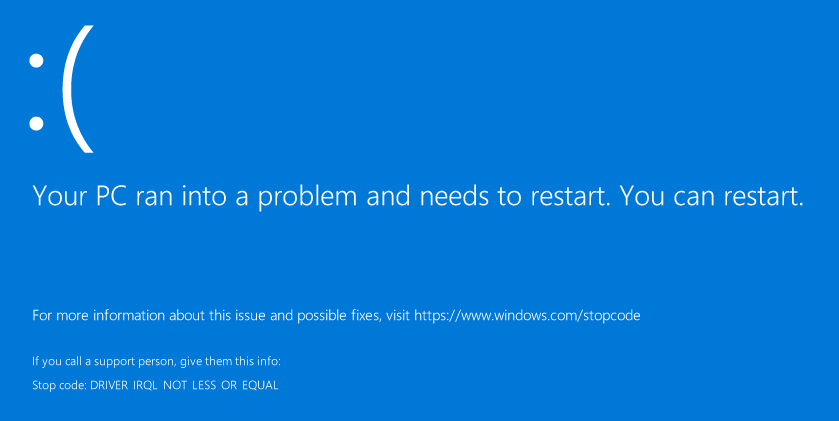
And with that done, we record the execution of our binary again. And now our VM crashes:
Again, the trace points us to the bug: we clearly see the capcom.sys driver executes a payload at 0x26c1dd20008:
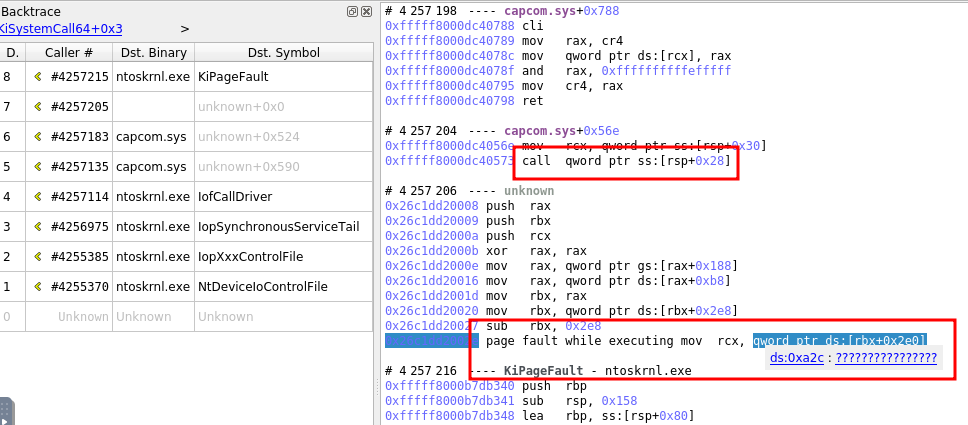
And that payload's address is indeed coming straight from our call to DeviceIO:
DeviceIoControl called at #4255203 call qword ptr ds:[rip+0x11d3c]
  hDevice = 0x1c4
  dwIoControlCode = 0xaa013044
  lpInBuffer = 0xafe6f3fca0
  nInBufferSize = 0x8
  [...]
-> ?
[0xafe6f3fca0] == 0x26c1dd20008
However, this payload does not seem to work as expected.
Debugging the payload
Let's extract our payload and take a closer look with Binary Ninja:
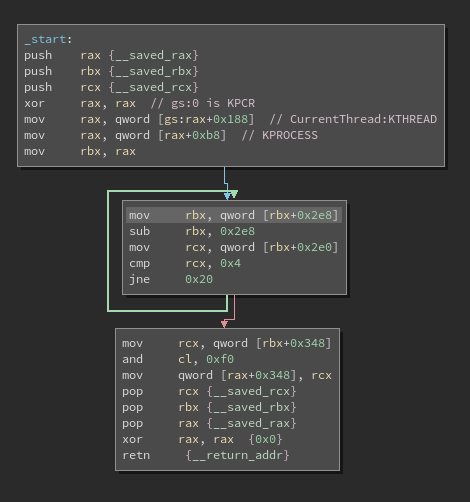
This reveals it is accessing the KPROCESS structure, at an offset of +0x2e0 and +0x2e8. However, this offset is outside of 1903's KPROCESS structure, and this will point into the container of KPROCESS: EPROCESS. In this structure, it is obvious that +0x2e8 is not a pointer, so our offset are wrong here.
However, there is a double linked list nearby: ActiveProcessLinks. It would make sense for the payload to parse the active processes and do stuff. Is there a version of this structure where +0x2e8 points to this list? As a matter of fact, there is: 1809's EPROCESS has this list right where we want it. So the code is doing the following:
void* gsbase
struct KPROCESS* myself = *(*(gsbase + 0x188) + 0xb8)
struct KPROCESS* proc = myself
do  // Look for SYSTEM process
    proc = proc->ActiveProcessLinks.Flink
    proc = proc - 0x2e8
while (proc->UniqueProcessId != 4)

int64_t rcx_2
rcx_2 = (*(proc + 0x348))
rcx_2.b = rcx_2.b & 0xf0
*(my_proc + 0x348) = rcx_2
But what about +0x348? This points to the back link of SessionProcessLinks, which doesn't make much sense, especially since our trace shows they are NULL pointers in the target SYSTEM process. Again, looking around the versions of this structure, we find that in Windows 8's EPROCESS, +0x348 points to Token (while ActiveProcessLinks is still at +0x2e8), which makes much more sense - we're trying to steal the SYSTEM token. Hence, we can now decompile our payload as:
void* gsbase
struct KPROCESS* myself = *(*(gsbase + 0x188) + 0xb8)
struct KPROCESS* proc = myself
do  // Look for SYSTEM process
    proc = proc->ActiveProcessLinks.Flink
    proc = proc - 0x2e8
while (proc->UniqueProcessId != 4)

struct _EX_FAST_REF rcx_2
rcx_2.Value = proc->Token.Value
rcx_2.Value.b = rcx_2.Value.b & 0xf0
myself->Token = rcx_2
Note: the token's lower 4 bytes which are set to 0 are the RefCnt.
From there, we have two options:
- Either use the right Windows version,
- Or make the payload work on our version
Patching the payload should be as easy as patching a few bytes, so let's try that. We want to turn this:
488b9be8020000     mov     rbx, qword [rbx+0x2e8]
4881ebe8020000     sub     rbx, 0x2e8
488b8be0020000     mov     rcx, qword [rbx+0x2e0]
;[...]
488b8b48030000     mov     rcx, qword [rbx+0x348]
;[...]
48898848030000     mov     qword [rax+0x348], rcx
into this:
488b9bf0020000     mov     rbx, qword [rbx+0x2f0]
4881ebf0020000     sub     rbx, 0x2f0
488b8be8020000     mov     rcx, qword [rbx+0x2e8]
;[...]
488b8b60030000     mov     rcx, qword [rbx+0x360]
;[...]
48898860030000     mov     qword [rax+0x360], rcx
We can patch it at one of two stages:
- Either patch the packed binary itself
- Or patch the payload right before execution
We first tried to patch the binary itself because it was more fun, half expecting it to trip a checksum somewhere.
Patching the binary
There are five bytes to patch, and for each a similar method is used. We'll use the value e0 as example:
- Taint the instruction's byte backward to see where it's coming from:
- We find the origin is written from an instruction's immediate, which the taint does not follow:
mov dword ptr ss:[rbp-0x80], 0x2e08b - We taint this immediate again, and we find the moment it gets unpacked, giving us the origin's location within the executable itself.
mov dl, byte ptr ds:[rsi]
Surprisingly, once patched this way the binary still seems to work. Moreover, the system now does not crash (hurray) and we see the following calls:
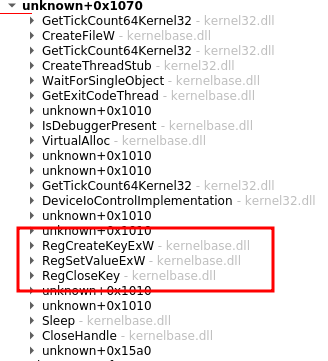
Some calls to access the registry stand out here. And after a closer look, we see that they write our flag to the registry key \\HKEY_CURRENT_USER\Software\Microsoft\Windows\CurrentVersion\Run\Flag.
RegSetValueExW called at #6398375 call qword ptr ds:[rip+0x11af6]
  hKey = 0x1cc
  lpValueName = Flag
  Reserved = 0x0
  dwType = 0x1
  lpData = DG\x04ACK{6\x01Fe9npGl\x01\x01xSOfkSQ7H\x01
  cbData = 0x38
-> 0x0
Wait... The flag is obviously corrupted. Is this due to us patching the binary? It probably is.
Patching the payload instead
Let's fall back to patching the in-memory payload instead, and keep the binary pristine. Again, we simply use GDB against the VM to break at 0xfffff8000dc40573, where the driver is about to execute the payload, and patch the few bytes.
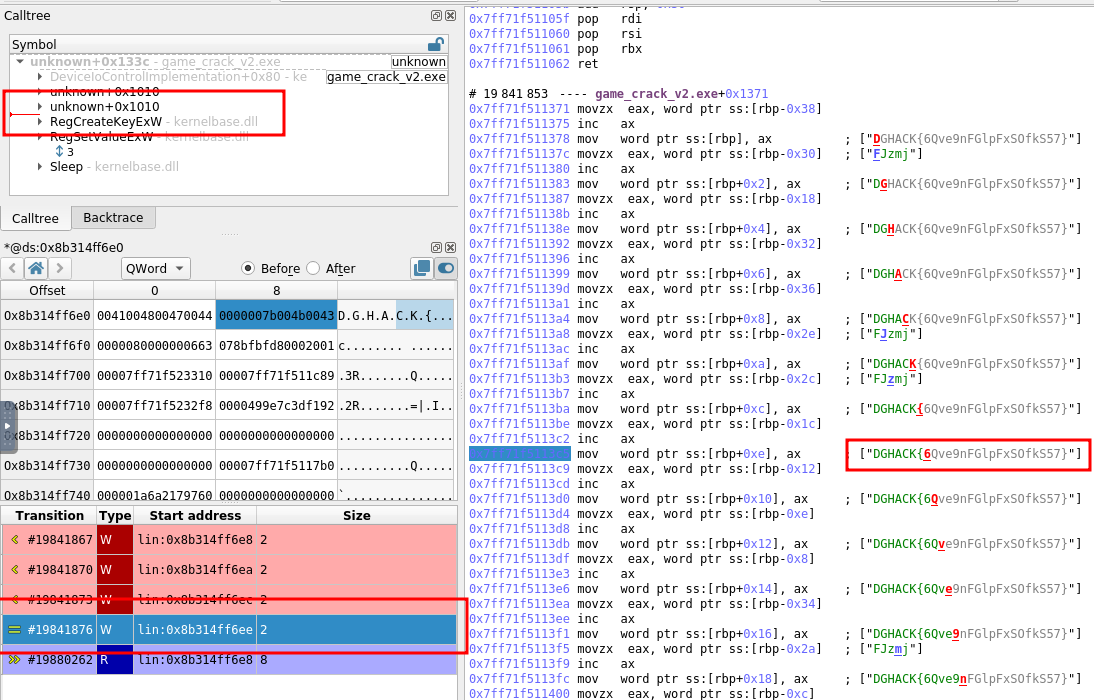
This time, the call to RegSetValueExW looks right:
RegSetValueExW called at #19879296 call qword ptr ds:[rip+0x11af6]
  hKey = 0x1cc
  lpValueName = Flag
  Reserved = 0x0
  dwType = 0x1
  lpData = DGHACK{6Qve9nFGlpFxSOfkS57}
  cbData = 0x38
-> 0x0
Woohoo!
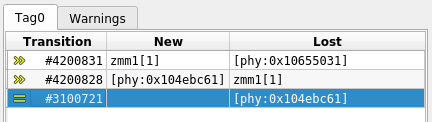
Could we have seen the flag in memory prior to this call? Well, not really: the memory access history shows that it is deobfuscated right before the call to RegCreateKeyExW(note that in the screenshot below, the grey characters are a predictive display - they are not yet written in memory but about to be):
In conclusion, solving the issues step by step, making a new recording each time, in order to force the challenge to run until the end turned out to be an effective approach.


