Guillaume Vinet
|
0
|
June 12, 2023


We keep going on with our blog post about assessing the strength of MCUBoot against fault injection attacks thanks to simulation. In the previous blog post, we presented MCUBoot, and described an attack scenario intending to make it execute arbitrary code.
In this blog post, we are going to present how to compile MCUBoot, then how to execute it with our simulation tool, esReverse, and ultimately how we will attack MCUBoot.
First thing first, we need to choose the MCUBoot code version that we wish to attack and compile it. The straightforward way is to start from the ARM Trusted Firmware-M (ARM TF-M) project. ARM TF-M is a reference implementation of the Platform Security Architecture (PSA) IoT Security Framework for ARMv7-M and Armv8-M architecture where the default secure bootloader is MCUBoot.
The Getting Starting Guides documentation explains step-by-step how to download and compile ARM TF-M, it is therefore the perfect solution to have both a MCUBoot binary code, and as well a signed image to feed it.
Let us skip the installation of the ARM TF-M compilation (python dependency and toolchain) which is well explained in the documentation, and directly jump to the code downloading where we take the latest tagged version TF-Mv1.7.0 (when this post was written). It contains the version 1.9.0 of MCUBoot code. Then, we compile the project with the cmake tool in two steps.
In the first step, the compilation environment is prepared, and customized with preprocessor directives.
cd trusted-firmware-m/
cmake -S . \
-B cmake_build \
-DMCUBOOT_LOG_LEVEL=OFF \
-DTFM_SPM_LOG_LEVEL=TFM_SPM_LOG_LEVEL_INFO \
-DTFM_PLATFORM=arm/mps2/an521 \
-DTFM_TOOLCHAIN_FILE=toolchain_GNUARM.cmake \
-DTEST_NS=ON \
-DTEST_S=ON \
-DTFM_PSA_API=ON \
-DMCUBOOT_FIH_PROFILE=OFF \
-DBL2=ON
Let us review some of these directives:
Then, the code is compiled.
cmake --build cmake_build -- install
Once this process is finished, we get the compiled files inside ./trusted-firmware-m/cmake_build/bin directory. The more valuable file are:
Now, let us present our emulation tool: esReverse.
esReverse is a tool providing a way to emulate your code running in a hardware device and subsequently perform dynamic analyses of the firmware. Close to the hardware device functional behavior, the esReverse’s emulation environment gives access to runtime data (registers, memory) for different architectures (ARM, Intel, RISC-V). It provides on one hand the capability to trace the firmware execution to generate Side Channel traces (with customized models), and on the other hand, to stress it against physical code injection, under user defined models. Additionally, it facilitates code profiling or fuzzing.
To simplify its usage, it can emulate different types of targets; a piece of code, a Linux ELF executable or a full system on a chip (SoC). A Python library and graphical widgets are provided to make it user-friendly. Finally, it is compatible with GDB to ease investigation.
The pieces of the puzzle are here, now we can enter in the emulation part.
Consistently with the build of MCUBoot and the target platform, setting esReverse is straightforward:
import esReverse


target = esReverse.TargetRawCode()
target.board = "mps2-an521"
Then, we indicate the ELF file containing the MCU-Boot code with the kernel option. Automatically, each piece of code will be copied in the right memory area.
target.kernel = "./trusted-firmware-m/cmake_build/bin/bl2.axf"
After that, let us indicate when to start and stop the code emulation with the Program Counter (PC):
target.pc_start = -1
target.pc_end = -1
esReverse offers a nice option called timeout_inst to enable a timeout measured in terms of executed instructions. In our case, we just chose this option to stop the program, so arbitrarily, we set a big value. But, in the context of security testing (with fault injection in particular), it is a good practice to set this option with the intended to handle endless loops.
target.timeout_inst = 0x8F00000
In order to set or retrieve data, two functions (process_input and process_output) serve as an interface to read or write data in specific memory addresses. In our case, no specific input is required, and the received output is collected as such from the emulation.
target.process_input = lambda data : []
target.process_output = lambda data : data
We have loaded the MCUBoot code, but the image containing the secure and non-secure OS is still missing in FLASH. The FLASH is emulated by creating a memory segment located at the address 0x10080000 and its size is 0x1000000.
target.mem_map = [{'address': 0x10080000, 'size': 0x100000}]
Then, we indicate the image file to copy its content at the address 0x10080000.
target.mem_set = [{'address': 0x10080000,
'filename': './trusted-firmware-m/cmake_build/bin/tfm_s_ns_signed.bin'}]
Everything is ready to launch the code:
print(target.run(""))
We obtain the expected output as you can see in the snippet below.
[WRN] TFM_DUMMY_PROVISIONING is not suitable for production! This device is NOT SECURE
[Sec Thread] Secure image initializing!
Booting TF-M v1.7.0


#### Execute test suites for the Secure area ####
Running Test Suite SFN Backend Secure test (TFM_S_SFN_TEST_1XXX)...
> Executing 'TFM_S_SFN_TEST_1001'
Description: 'Get PSA framework version'
TEST: TFM_S_SFN_TEST_1001 - PASSED!
> Executing 'TFM_S_SFN_TEST_1002'
Description: 'Get version of an RoT Service'
TEST: TFM_S_SFN_TEST_1002 - PASSED!
> Executing 'TFM_S_SFN_TEST_1003'
Description: 'Request a connection-based RoT Service'
TEST: TFM_S_SFN_TEST_1003 - PASSED!
> Executing 'TFM_S_SFN_TEST_1004'
Description: 'Request a stateless RoT Service'
TEST: TFM_S_SFN_TEST_1004 - PASSED!
With the Tracer we can get a trace of the PC from the execution:
tracer = esReverse.Tracer(target)
tracer.targets = ["pc"]
tracer.generate_traces([""])
We obtain a trace file where each PC value is a 32 bit integer. Below, we display it with annotations to have a better understanding of the code execution.
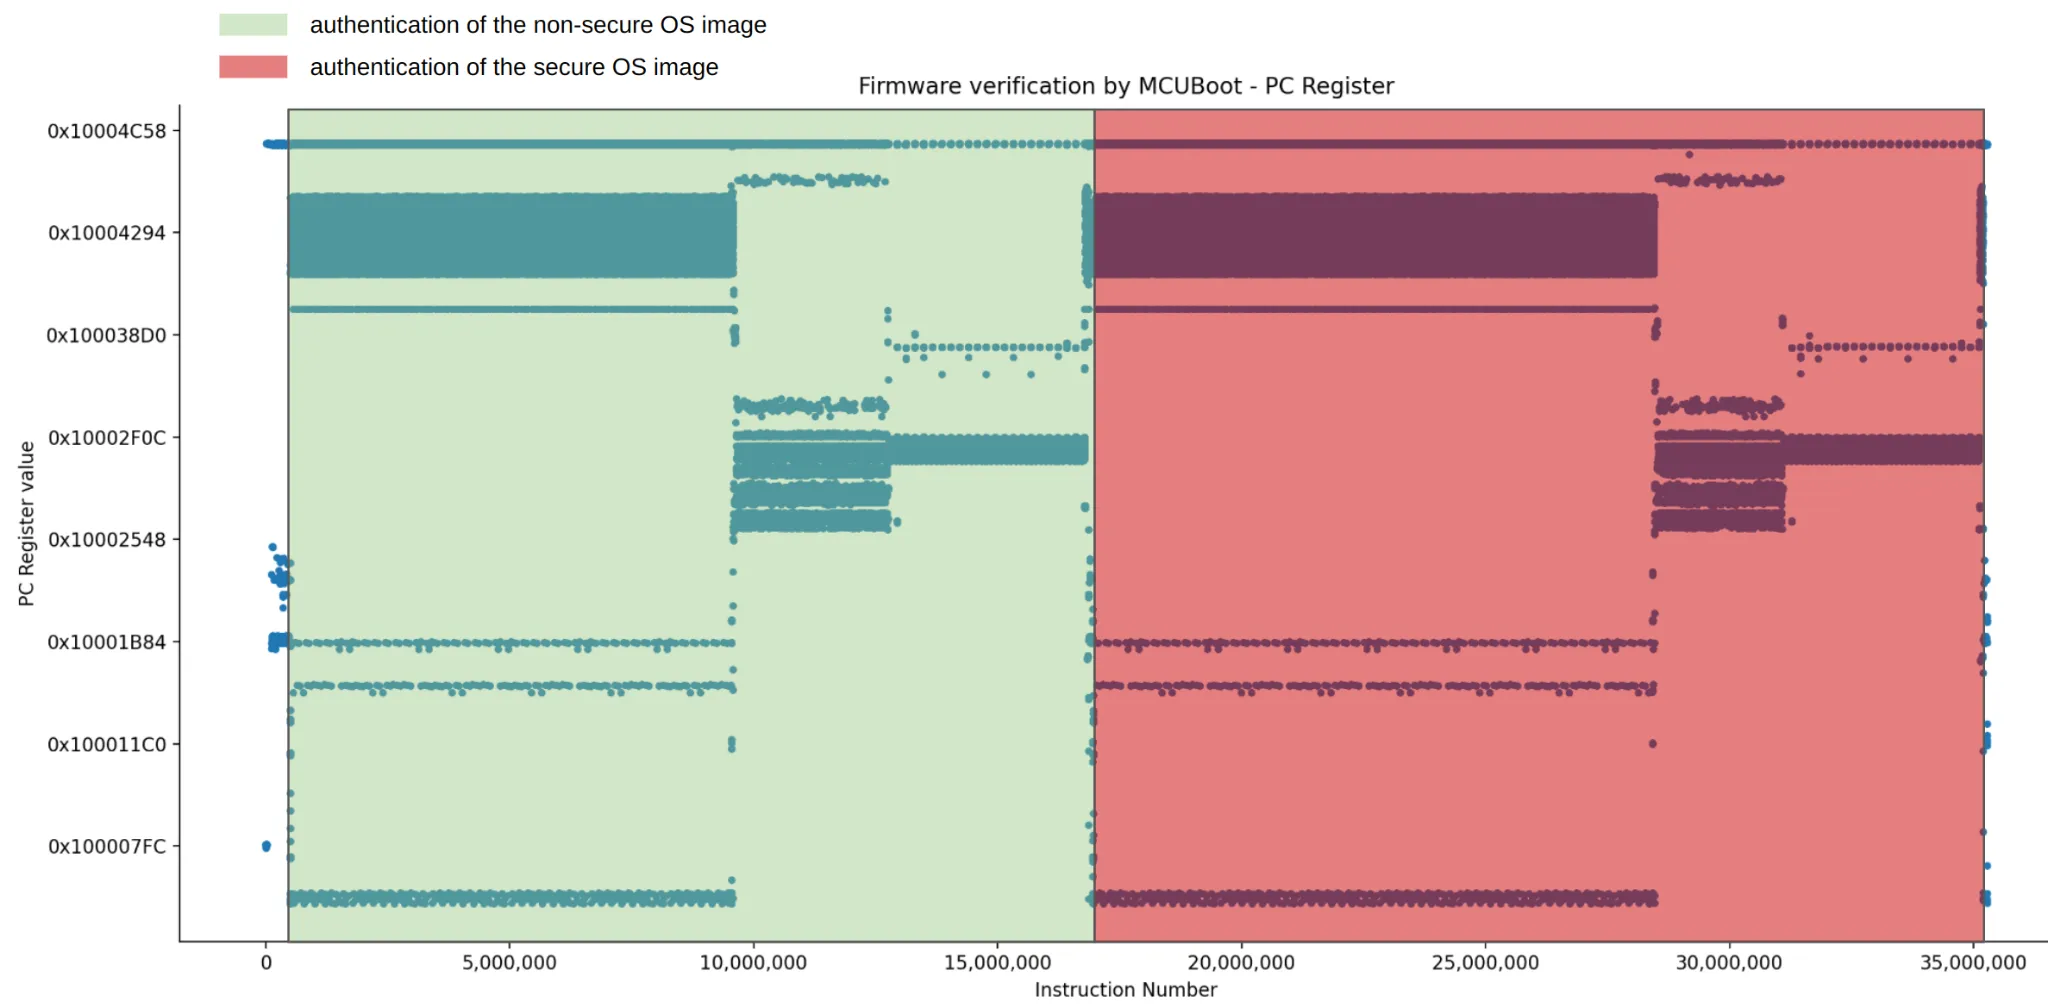
Figure 1: Firmware verification by MCUBoot - PC register trace.
We observe two main items: the authentication of the non-secure OS image, and then the secure-OS image. The second iteration is slightly bigger than the first one: it is perfectly understandable since the size of the secure image is bigger.
The same operations are performed for both images, so let zoom on the first authentication to have a better view:
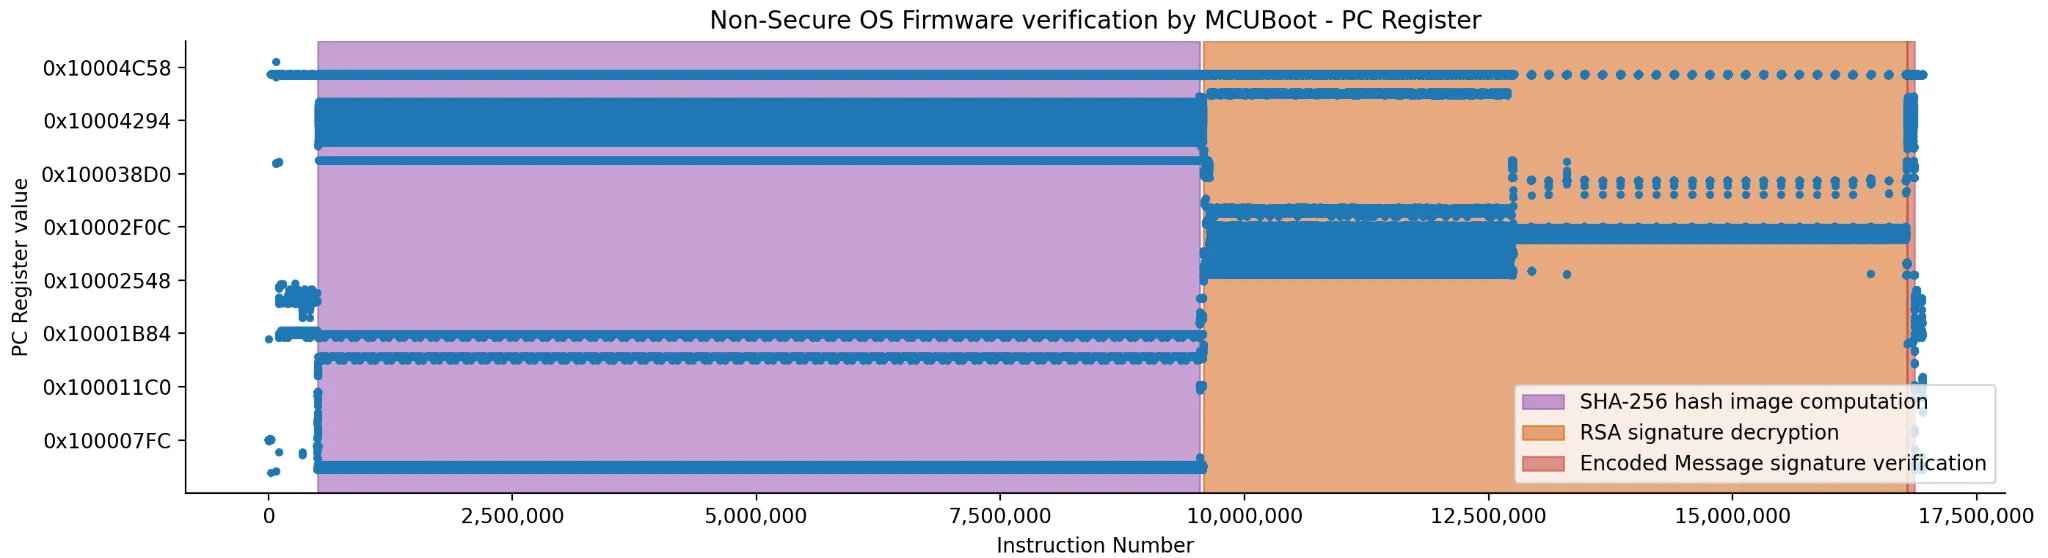
Figure 2: First image verification by MCUBoot - PC register trace.
We managed to emulate MCUBoot code in a few lines with esReverse and performed a quick graphical analysis of the code execution. In the previous blog post, I have pointed out two attack scenarios. But, for the sake of simplicity, I will focus here on the second one. Just recall the objective of this scenario: to put an arbitrary code inside the image and execute it. Because we change the image, the code signature will be inconsistent, and so I need to disturb the code authentication to get it accepted as genuine.
To create an altered image, it is as easy as pie; we just need to modify the signature of the genuine code by changing arbitrarily one byte.
The consequence is that the signature will be rejected. As described in the part 1 “Walk around the code”, the verification will fail inside the main function. More precisely, according to the result of the comparison, stored in the fih_rc variable, we will enter in an endless loop as seen in the code snippet below.
// bl2_main.c:154-158
if (fih_not_eq(fih_rc, FIH_SUCCESS)) {
BOOT_LOG_ERR("Unable to find bootable image");
FIH_PANIC;
}
If I perform a small reverse engineering of the bl2.axf file, I see that the if statement is implemented in two instructions:
.text:10000604                 CMP          R3, fih_rc
.text:10000606                 BEQ          loc_1000060A
.text:10000608                 B               loc_10000608
We need a way to check that the attack is successful. According to the code, we can stop the emulation at the address 0x10000606 and check the value of the register r0. If it is equal to zero, the attack is considered as successful since we do not enter in the endless loop.
It is useless to start tampering with the program as soon as it starts. In accordance with the code analysis that we made in the previous post, we can start to disturb it when the bootutil_img_validate function is called, corresponding to the address 0x10001648. We update our python script to take these changes into account.
tracer.trig_and_acts = [[0x10001648, 1, "start-trace"]]
We indicate when to stop the emulation.
target.pc_end = 0x10000606
And we ask to display the r0 register at the end of the emulation.
target.ending_display = [{'register': "r0"}]
We generate a new trace and display its length:
tracer.generate_traces([""])
pc_full_np = np.fromfile("./full_trace_pc/_0x1.bin", dtype='uint32')
print(len(pc_full_np))
There are more than 16,000,000 executed instructions, and so the same number of instructions to tamper with! This is the classic problem of simulation which is the combinatorial explosion due to the number of different parameters to test, in particular the instructions where to inject the fault. Moreover, the complexity is also increased by the number of input parameters, and the possible fault models.
We can tackle this issue in two ways:
We made the choice of the former approach. We analyze the PC distribution of the executed instructions. Perturbing the cryptographic functions to obtain our expected results (code and signature consistent) is complex. Since the memset and memcpy are the majority of called functions, let us remove them from the scope and see what we can get. So, in our case, we can remove from the scope of the faulted instructions corresponding to:
With esReverse, we can easily trace only a specific list of instructions according to their PC values. With a small reverse engineering of the binary, we create the list of the PC to acquire while dropping the instructions related to the functions listed previously. We name this list pc_to_trace, and give it to esReverse tracer.
tracer.filt_pre.in_pc_.pts = pc_to_trace
We regenerate the trace, and display its size.
tracer.generate_traces([""])
pc_full_np = np.fromfile("./full_trace_pc/_0x1.bin", dtype='uint32')
print(len(pc_full_np))
Now, we render with only 66,000 instructions. With such a number of instructions to be faulted, a fault campaign became realistic, and will be the topic of our next post where we will attack MCUBoot implementation!
Thanks to Pylou for proofreading this article.


