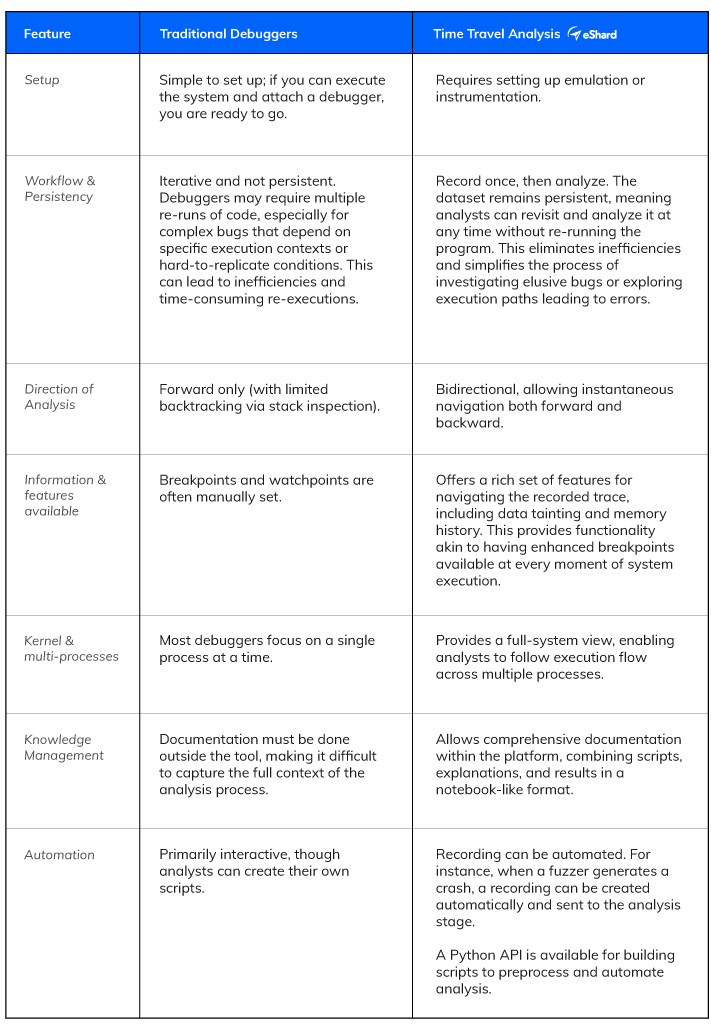
Time Travel Analysis vs. Traditional Debuggers

Imagine this: you’re analyzing a vulnerability that only occurs under specific conditions. It’s triggered by an unusual input or a rare sequence of events hidden deep within the program. You set breakpoints, inspect variables, and step through lines of code, hoping to isolate the issue. Each attempt feels like a step closer, but you miss a critical clue and end up having to start over. Frustrating, right?
This is the reality for many security analysts using traditional debuggers. While tools like GDB, WinDBG, and IDA Pro are indispensable, they operate linearly: you move forward, and if you miss something, you start over.
That’s where esReverse’s Time Travel Analysis (TTA) comes in. It records program execution so you can rewind, replay, and analyze key moments with ease.
Let’s dive into how traditional debugging compares to time travel debugging and why it’s changing the game for security analysis.

👾 Traditional debuggers: Tried and true
For decades, traditional debuggers have been the go-to tools for analyzing program behavior. Whether you’re debugging a simple app or diving into kernel-level code, these tools offer powerful capabilities:
🔹 Pause code at specific points and execute it line by line.
🔹 Watch how values in memory and registers change during execution.
🔹 Examine the call stack to trace a program’s journey to its current state.
🔹 Explore and modify data stored at specific memory addresses.
Basically, you’d set a breakpoint where the crash occurs and inspect variables to see where things went wrong. While this process works for simpler bugs, it quickly runs into problems with more complex issues.
🚧 You can only move forward. Miss a clue? Restart the program.
🚧 Debuggers show the current state but often lack historical context, making it tough to pinpoint the root cause of bugs.
🚧 Debugging across platforms or interacting processes requires intricate setups.
🚧 Bugs tied to rare conditions or multi-threaded interactions can be very hard to find and fix.
Take kernel debugging as an example. If a race condition between two processes causes a crash, traditional tools may capture the immediate error but fail to provide enough context to trace it back to the root cause.
Now imagine a different approach: instead of running the program over and over, what if you could record its execution and navigate through it like a timeline? This is the power of Time Travel Analysis, a cutting-edge technique integrated into our esReverse platform.

⏳ Time travel analysis: Debugging with a time machine
Time travel analysis is an advanced analysis technique that provides a more comprehensive look at program execution. Once the system execution is recorded, TTA offers a persistent dataset, providing analysts with all the runtime information they need in one place.
Without time pressure, the dataset is available for thorough inspection of the entire execution flow, allowing analysts to move backward and forward through time seamlessly, with a full runtime environment recorded during the execution. This allows the expert to go further to locate points of interest and trace their impact, with advanced features, like data tainting and memory access history aiding in detailed analysis.
Time Travel Analysis shines in scenarios where traditional debuggers fall short:
Vulnerability Research on Chrome’s CVE-2020-15999
We used time travel debugging to analyze this heap buffer overflow vulnerability caused by a specific sequence of font rendering calls. By rewinding the execution, we tracked memory changes and applied taint analysis to uncover the root cause. Traditional tools would have required multiple attempts to piece this together, but with time travel, the entire process became seamless.
Vulnerability Research on Linux Firmware Bug
Another challenge came with the Tenda AC15 firmware. Using the Qiling framework to emulate the firmware, we reproduced a stack overflow triggered by malformed input. Time travel debugging captured the execution, letting us rewind to the moment the vulnerability was triggered. This direct access to memory corruption and execution paths helped us create a robust fix efficiently.
Vulnerability Research on Android App
On mobile apps, time travel is just as powerful. While analyzing an Android app for potential data leaks, we used Frida on a real device to generate an execution trace. This allowed us to pinpoint specific API calls mishandling user data, uncovering a flow of sensitive information that real-time tools simply couldn’t track.
Malware Analysis
Now, picture a piece of Windows malware designed to hide in plain sight. It downloads encrypted payloads at runtime, decrypts them, and executes the malicious code—all while using sophisticated evasion techniques. Traditional analysis tools can capture snapshots of the malware’s behavior, but they often miss the bigger picture, leaving analysts to piece together fragments.

For simple bugs in straightforward workflows, traditional debuggers work just fine. But when dealing with complex vulnerabilities, elusive malware, or issues that defy reproduction, time travel debugging is essential.
Request a demo today to see Time Travel Analysis in action!


