

ALL-IN-ONE PLATFORM
esDynamic
Manage your attack workflows in a powerful and collaborative platform.
Expertise Modules
Executable catalog of attacks and techniques.
Infrastructure
Integrate your lab equipment and remotely manage your bench.
Lab equipments
Upgrade your lab with the latest hardware technologies.


PHYSICAL ATTACKS
Side Channel Attacks
Evaluate cryptography algorithms from data acquitition to result visualisation.
Fault Injection Attacks
Laser, Electromagnetic or Glitch to exploit a physical disruption.
Photoemission Analysis
Detect photon emissions from your IC to observe its behavior during operation.


EXPERTISE SERVICES
Evaluation Lab
Our team is ready to provide expert analysis of your hardware.
Starter Kits
Build know-how via built-in use cases developed on modern chips.
Cybersecurity Training
Grow expertise with hands-on training modules guided by a coach.


ALL-IN-ONE PLATFORM
esReverse
Static, dynamic and stress testing in a powerful and collaborative platform.
Extension: Intel x86, x64
Dynamic analyses for x86/x64 binaries with dedicated emulation frameworks.
Extension: ARM 32, 64
Dynamic analyses for ARM binaries with dedicated emulation frameworks.
DIFFERENT USAGES
Penetration Testing
Identify and exploit system vulnerabilities in a single platform.
Vulnerability Research
Uncover and address security gaps faster and more efficiently.
Code Audit & Verification
Effectively detect and neutralise harmful software.
Digital Forensics
Collaboratively analyse data to ensure thorough investigation.


EXPERTISE SERVICES
Software Assessment
Our team is ready to provide expert analysis of your binary code.
Cybersecurity training
Grow expertise with hands-on training modules guided by a coach.

INDUSTRIES
Semiconductor
Automotive
Security Lab
Gov. Agencies
Academics
Defense
Healthcare
Energy

ABOUT US
Why eShard?
Our team
Careers


FOLLOW US
Linkedin
Twitter
Youtube
Gitlab
Github


Who corrupted the data? — a Taint Analysis overview

In vulnerability analysis a frequent question that needs answering is: “who corrupted this data?”.
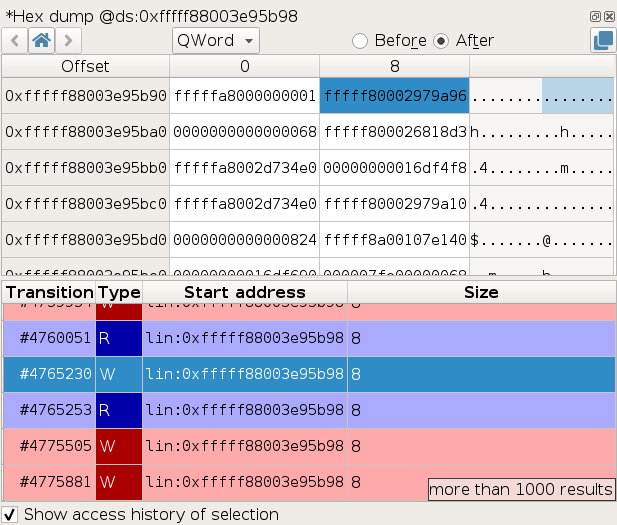
Time travel debuggers like esReverse offer rapid and precise answers to this critical question. For instance, the Memory History feature of esReverse enables users to trace all accesses to a specific memory location, pinpointing the exact access that caused the corruption.
With esReverse, identifying the source of corrupted data becomes even more straightforward through backward taint analysis. This technique traces the corrupted data back to its origin, such as an input buffer, without manually searching through memory copies or CPU register manipulations. This method is not only faster and simpler but also minimizes errors due to its systematic nature.
The taint feature is a favorite among our users and is considered the most powerful capability of esReverse. It allows for instant tracing from a crash back to the input file that caused it. This feature represents years of development effort and leverages the time travel debugging nature of esReverse to enable both backward taint analysis and significant performance optimizations.
Let's start with how taint analyis work.
How does taint analysis work?
Taint analysis works by marking certain inputs as tainted and then propagating this information through the instructions that manipulate the tainted data.
The output of this algorithm is a list of instructions where the tainted state of some data changes or where tainted data is used, which is useful for "slicing" a program according to some tainted data.
In esReverse, taint analysis supports data flow propagation with inputs that can be x86_64 registers and memory ranges, and the propagation can be forward or backward.
Forward and Backward Propagation Examples
Forward Register Propagation
; Start of propagation
; input: rax tainted
mov rbx, rax
; output: rax and rbx tainted
; End of propagation
Since this instruction moves the contents of rax into rbx, the value of rbx is directly dependent on the value of rax.
Forward Memory Propagation
; Start of propagation
; input: rax tainted
add qword ptr [r8+0x10], rax
; rax, [ds:0xfffff80002802cd0 ; 8] tainted
mov ebx, dword ptr [r8+0x14]
; output: rbx[0; 4], rax, [ds:0xfffff80002802cd0 ; 8]
; End of propagation
For memory accesses, the dereferenced address is resolved to its runtime address, here ds:0xfffff80002802cd0. The corresponding range of 8 bytes becomes tainted after the addition which makes it depend on both its initial value and on rax.
Then, the second instruction taints ebx from the 4 last tainted bytes of the range [ds:0xfffff80002802cd0 ; 8]. Note that the taint in esReverse is able to track taint state at the byte level.
Backward Propagation
; End of propagation (start at the last instruction in backward)
; output: rbx, [ds:0xfffff80002802cd0 ; 8] tainted
add rbx, qword ptr [r8+0x10]
; rbx tainted
mov rax, rbx
; input: rax tainted
; Start of propagation
Backward propagation starts from the final instruction and traces back to the initial instruction, adjusting taints based on the values transferred and dependencies.
The propagation rules are a bit different as in forward, as in the instruction mov rax, rbx, rax takes its value from rbx. That means that the value of rax after propagating through this instruction depends solely on the value of rbx, which is why rbx becomes tainted and rax loses the taint.
In the add rbx, qword ptr [r8+0x10] instruction, the value of rbx depends on both the value of rbx prior to the addition, and on the value at address ds:0xfffff80002802cd0, hence the final result.
OK, this gives us a basic understanding of what taint propagation is like. Now, how do we implement such an algorithm so that it can run on real x86 instruction traces of several billions of instructions? Let’s find out.
Implementing Taint Analysis
Implementing taint analysis involves several steps: sequencing, lifting, and propagating.
-
Sequencing: Determine the next sequence of transitions from the execution trace on which taint should be propagated. Most of the time, this is the sequence that starts after the end of the previous sequence, and that stops when the sequence roughly corresponds to a basic block. However in some cases there can be jumps in the trace due to memory history optimization (more on that in a later section), or the taint can stop if nothing is tainted anymore or if we reached the end of the requested range of transitions.
-
Lifting: Generate LLVM instructions from the sequence of transitions. Each x86_64 instruction in the sequence is lifted to multiple LLVM instructions using the excellent open-source library remill. Lifted instructions are further optimized using LLVM’s optimizer, to improve the taint accuracy. Already seen sequences are fetched from the cache to avoid lifting and optimizing again, as those are cpu-intensive operations.
-
Propagating: On each LLVM instruction produced from lifting the sequence of x86_64 instructions, apply our propagation algorithm. The algorithm maintains and modifies the state of what is tainted according to the propagation rules we defined. What does the propagation algorithm look like? Before answering this question, let’s take a detour through the LLVM optimization engine.
Exploiting LLVM’s Optimization Engine
During the lifting step, we also apply some optimizations to the produced LLVM to improve the accuracy of the propagation. For a simple example of a case where optimization helps, consider the following sequence of instructions:
mov rbx, rax
xor rax, rbx
If these instructions are taken separately, the propagation algorithm is forced to keep any taint on rax because it cannot assert that rax == rbx. This results in over-taint, which can cause the taint to report spurious links between data that are actually unrelated.
By lifting with the optimizations enabled, the optimizer is able to recognize that the above is actually semantically equivalent to:
mov rax, 0
This optimized version allows the taint to successfully remove any taint on rax and avoid over-tainting.
The optimization engine of LLVM is very powerful (it powers the clang compiler) and allows for simplifying very complex cases, from which the taint benefits.
Propagation Algorithm Example
The propagation algorithm uses a classic LLVM instruction visitor.
Here is a (simplified) example of the propagation algorithm on an LLVM instruction:
/// Instruction of the form `x = v[i]`.
///
/// Either `i` is statically known, in which case the markers of `v[i]` are propagated to `x`,
/// or `i` is determined at runtime, in which case the markers of `forall j, v[j]` must be propagated to `x`.
void TaintPropagationVisitor::visitExtractElementInst(llvm::ExtractElementInst& inst) {
    auto dest_size = get_type_size_bytes(layout_, inst.getVectorOperandType()->getElementType());
    auto index = inst.getIndexOperand();
    auto* maybe_const_index = llvm::dyn_cast<llvm::ConstantInt>(index);
    auto* vector_operand = inst.getVectorOperand();
    if (maybe_const_index) {
        const auto const_index = maybe_const_index->getValue().trunc(64).getZExtValue();
        // v[const_index] to inst
        taint_map().propagate_marker({vector_operand, const_index * dest_size, (const_index + 1) * dest_size}, &inst);
    } else {
        // all of v is propagated to inst
        const auto count = inst.getVectorOperandType()->getNumElements();
        for (std::size_t i = 0; i < count; ++i) {
            // v[i] to inst
            taint_map().propagate_marker({vector_operand, i * dest_size, (i + 1) * dest_size}, &inst);
        }
    }
}
In the example above, “markers” are used to indicate which piece of data is tainted. The taint in esReverse actually supports propagating an arbitrary number of markers, which allows, for instance, tainting each byte of an input buffer with a different marker to determine what part of the tainted data comes from each byte of the input buffer after the propagation.
The example allows forward propagation in a LLVM vector instruction that extracts an element from a vector by indexing it. When the index is constant, we can use it in the taint to propagate only the markers of that precise element of the vector.
However, when the index is a runtime value, the best we can do is propagate the markers of each element in the vector to the produced value. If in reality there are stricter conditions on the index that restrict the value it can take at runtime, then this may produce over-taint. In practice, though, this particular cause of over-tainting was not often observed.
Exploiting Memory History as a Performance Optimization
Iterating, lifting x86_64 instructions, and then optimizing and propagating on LLVM instructions are slow, intensive operations. When only memory (no register) is tainted, we can actually do better in esReverse. Using the Memory History in the sequencing step of the taint algorithm, we can request the transition where the tainted memory will be accessed next and skip lifting the entire portion of the trace up until the tainted memory is accessed. This sometimes allows skipping billions of transitions, and is instrumental in the great performance of the taint.
Validating the Taint
From the start, validating that the taint gives correct results was a priority of ours. To do so, we worked on two avenues:
- Testing the taint.
- Designing the taint so that it can self-report inconsistent propagation events.
Testing the Taint
For (1), we manually crafted more than 230 unit tests, such as the following:
BOOST_AUTO_TEST_CASE(test_by_inst_2) {
    make_monomarker_taint_by_inst</* forward */ true>({amd64::rax}, "xor rbx, rax\n" // rbx = rbx_0 ^ rax
                                                                    "xor rdx, rax\n" // rdx = rdx_0 ^ rax
                                                                    "mov rcx, rax\n" // rcx == rax
                                                                    "xor rbx, rcx\n" // rbx = rbx_0
                                                                    "mov rdx, rcx\n" // rdx == rax
                                                                    "sub rdx, rax\n" // rdx = 0
                                                                    "div rax", // rax = (rdx:rax) /rax = rax / rax = 1
                                  {
                                      {amd64::rax, amd64::rbx, amd64::sf, amd64::zf, amd64::pf},
                                      {amd64::rax, amd64::rbx, amd64::rdx, amd64::sf, amd64::zf, amd64::pf},
                                      {amd64::rax, amd64::rbx, amd64::rcx, amd64::rdx, amd64::sf, amd64::zf, amd64::pf},
                                      {amd64::rax, amd64::rcx, amd64::rdx},
                                      {amd64::rax, amd64::rcx, amd64::rdx},
                                      {amd64::rax, amd64::rcx},
                                      {amd64::rcx}
                                  });
}
In this example, we test the taint in the forward direction, with rax tainted initially, on a set of instructions starting with xor rbx, rax, and we compare the resulting taint state after each instruction to the expected taint state passed as the last parameter to make_monomarker_taint_by_inst.
Taint Self-Report
For (2), we equipped the taint with the ability to report warnings to users in various situations, such as when encountering an instruction that we are not able to lift or propagate through just yet.
The warnings can be found in the Warnings tab of the Taint widget, and the ones that occur in the same sequence of transitions as a change to the taint will also be reported with a warning sign in the list of changes in the taint widget.
The list of warnings can also be accessed programmatically through the API for scripting purposes.
Building Applications on the Taint
The taint provided by esReverse offers an API that can be used as a building block for building more advanced algorithms.
By directly using the API, we are able to build a taint that follows tainted data at the resolution of each process:
# display taint result each time we change to a different process
process = None
table = ""
# iterate over all changes in tainted data
for change in taint.changes().all():
  new_process = change.transition.context_before().ossi.process() # get current process

  if process is None or new_process.pid != process.pid: # we changed process
      table += table_line(["#{}".format(change.transition.id),
                           new_process, read_tainted_memory(change)])
      process = new_process

display_table(title="Process changes for the forward taint of 'Hello!'",
            headers=["Transition", "Process", "Tainted memory"],
            html_lines=table)
Taint the pointer resulting from an allocation in order to track uses of that pointer and its aliases, which is used to detect use-after-free (UAF) and buffer overflow (BoF) vulnerabilities.
Conclusion
esReverse’s taint analysis is a powerful tool for vulnerability analysis, enabling faster detection and analysis of data corruption sources. It can be used both for direct vulnerability analysis and to implement higher-level algorithms such as use-after-free (UAF) and buffer overflow (BoF) vulnerability detection.
We continue to enhance our tools to deliver higher value to reverse engineers and developers, with exciting features like a call tree view and a dependency graph for tainted values.
Explore the capabilities of esReverse and enhance your vulnerability analysis with our advanced taint analysis feature.